Difference between revisions of "NeoScan for Antenna Characterization"
Kazem Sabet (Talk | contribs) |
Kazem Sabet (Talk | contribs) |
||
| Line 87: | Line 87: | ||
[[NeoScan]]'s non-invasive electro-optic probes have made it possible to directly measure and map the aperture-level fields of a radiating antenna. When dealing with radiating systems, mapping the near fields can have two different purposes. For the purpose of far-field radiation pattern estimation, you don't want to get too close to the surface of the antenna to avoid picking up all the reactive fields and evanescent modes. If you do so, you will need a rather high spatial resolution to capture the field variations with very precise details. On the other hand, for the purpose of diagnostic near-field mapping, you do need a very high spatial resolution and you want to maintain the field probe as close as possible to the surface of the antenna under test. [[NeoScan]] does both jobs for you and meets both sets of requirements with one system and the same probes. | [[NeoScan]]'s non-invasive electro-optic probes have made it possible to directly measure and map the aperture-level fields of a radiating antenna. When dealing with radiating systems, mapping the near fields can have two different purposes. For the purpose of far-field radiation pattern estimation, you don't want to get too close to the surface of the antenna to avoid picking up all the reactive fields and evanescent modes. If you do so, you will need a rather high spatial resolution to capture the field variations with very precise details. On the other hand, for the purpose of diagnostic near-field mapping, you do need a very high spatial resolution and you want to maintain the field probe as close as possible to the surface of the antenna under test. [[NeoScan]] does both jobs for you and meets both sets of requirements with one system and the same probes. | ||
| − | |||
| − | |||
In short, with [[NeoScan]], you get a compact portable self-contained system that characterizes your antenna system from the very near fields to the very far fields without requiring considerable real estate. | In short, with [[NeoScan]], you get a compact portable self-contained system that characterizes your antenna system from the very near fields to the very far fields without requiring considerable real estate. | ||
| + | |||
| + | |||
| + | For instance, you can examine the inter-element coupling effects in passive and active phased arrays. The figure below shows a 64-element fixed-beam X-band patch antenna array with an elaborate micostrip corporate feed network operating at 10.65GHz. The array was designed with a uniform amplitude distribution, i.e., it should supply equal powers to all the 64 patch radiators. | ||
| Line 102: | Line 103: | ||
</tr> | </tr> | ||
</table> | </table> | ||
| + | |||
| + | |||
| + | As the video shows, the low-resolution near-field maps at a higher height above the array surface provide a good estimate of the far-field radiation patterns, but they do not reveal much about the field distribution of the individual radiating elements. To accomplish the latter, you have to bring the probe down much closer to the radiating aperture. From the figures below, you can easily see that a large portion of the supplied RF power is trapped in the feeding transmission lines, and some patch elements receive much lower power levels than the others. | ||
| + | |||
<table> | <table> | ||
| Line 111: | Line 116: | ||
<tr> | <tr> | ||
<td> | <td> | ||
| − | [[Image: | + | [[Image:NEOWEB44.png|thumb|720px|Radiation pattern graphs of the 64-element X-band patch antenna array in the principal E and H planes.]] |
</td> | </td> | ||
</tr> | </tr> | ||
Revision as of 21:04, 27 January 2016
Contents
- 1 From Near Fields to Far Fields
- 2 NeoScan vs. Conventional Near-Field Scanning Systems
- 3 A Low-Cost Alternative to Costly Anechoic Chambers
- 4 One System for Both Near & Far Field Characterization
- 5 The Perfect Solution for Characterizing Ultra-wideband Antenna Systems
- 6 The Perfect Solution for Characterizing High-Power Antenna Systems
From Near Fields to Far Fields
NeoScan systems can be used as an essential tool for characterization, test and evaluation of antennas and phased array systems. It is a well-established fact that once you have an accurate estimate of the aperture fields, you can compute the far-field radiation patterns of an antenna with reasonable accuracy. This fact is based on the equivalence principle and the Huygens theory in electromagnetics. Time domain electromagnetic simulation tools such as EM.Tempo use a near-to-far-field transformation based on this principle to compute the far-zone fields of any radiating structure. In general, by far fields we mean the electric fields evaluated in the far zone of a physical structure, which satisfies the following condition:
- [math]r \lt\lt \frac{2D^2}{\lambda_0}[/math]
where r is the distance between the observation and source points, λ0 is the free space wavelength and D is the largest dimension of the radiating structure.
Click here to learn more about the theory of Near-to-Far-Field Transformation.
The radiation patterns of antennas and arrays are traditionally measured in anechoic chambers. The size of the chamber, its architecture and the quality of the surrounding absorbers all affect the chamber's frequency range of operation and the accuracy of the measured results. For example, in order to characterize an HF antenna operating at 40MHz, you need a very large and deep anechoic chamber several meters long. Anechoic chamber facilities are very expensive, require a large space and are hard to operate and maintain. Compact ranges are smaller replacements for full-sized chambers.
Near-field scanning systems are by far the most compact alternatives for antenna pattern measurement. Yet, conventional near-field scanning systems have substantial downsides. These systems involve metallic radiators that act as receivers for picking up the near field of the antenna under test (AUT). Such metallic pickup antennas cannot get close to the AUT since they would perturb its near fields. They also limit the operational bandwidth of the system, and their accuracy degrades significantly at lower frequency bands. Sophisticated error correction and compensation algorithms are often used in conjunction with these systems to de-embed and minimize various errors due to their specific architectures and configurations.
NeoScan vs. Conventional Near-Field Scanning Systems
NeoScan provides a unique and highly superior alternative to the conventional near-field scanning systems. Some of the very attractive features of the NeoScan probes are:
- They are optical by nature.
- They provide extremely large bandwidths.
- They have very small footprints.
- They are completely made of dielectric materials and have no metallic parts.
- They are non-invasive and invisible to the radiating antenna.
- They can get very close to the surface of the antenna for diagnostic mapping.
- They can be placed farther from the surface of the antenna for faster near-field scanning for the purpose of far field computation.
- They measure near-fields "As Is" and do not require error correction or compensation.
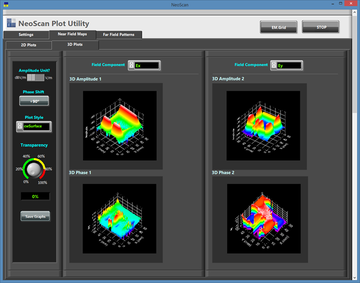
The figures below show the amplitude and phase distribution of the X and Y components the electric field slightly above the surface of the microstrip-fed patch antenna measured at 2.349GHz. Both 2D intensity plots and 3D surface plots are shown. The field amplitude is expressed in dBV/m, while the phase is expressed in degrees. The field scan data can be imported to EM.Cube with more visualization capabilities. For example, the field components can be combined to produce very informative vector field plots.
A Low-Cost Alternative to Costly Anechoic Chambers
The NeoScan-ANT system configuration comes with an operational software that quickly determines and suggests the optimal parameters for the fastest scan. Based on the physical aperture size, height of the probe above the radiating aperture, and desired angular accuracy, scan parameters such as the total scan area and mechanical step resolution are estimated using the near-field scanning theory. The user can always override the default settings and take total control of the operation manually.
The radiation patterns of the AUT are readily computed using a rigorous near-to-far-field transformation without any need for eliminating artifact errors. The figure below shows the total, theta and phi components of the radiation patterns of the microstrip-fed patch antenna measured at 2.349GHz in the principal E and H planes. Besides the 2D Cartesian and polar radiation pattern graphs, the fully polarimetric 3D far field data of the AUT are generated and saved to an ASCII data file, which can be imported to EM.Cube for visualization, analysis and other purposes.
One System for Both Near & Far Field Characterization
NeoScan's non-invasive electro-optic probes have made it possible to directly measure and map the aperture-level fields of a radiating antenna. When dealing with radiating systems, mapping the near fields can have two different purposes. For the purpose of far-field radiation pattern estimation, you don't want to get too close to the surface of the antenna to avoid picking up all the reactive fields and evanescent modes. If you do so, you will need a rather high spatial resolution to capture the field variations with very precise details. On the other hand, for the purpose of diagnostic near-field mapping, you do need a very high spatial resolution and you want to maintain the field probe as close as possible to the surface of the antenna under test. NeoScan does both jobs for you and meets both sets of requirements with one system and the same probes.
In short, with NeoScan, you get a compact portable self-contained system that characterizes your antenna system from the very near fields to the very far fields without requiring considerable real estate.
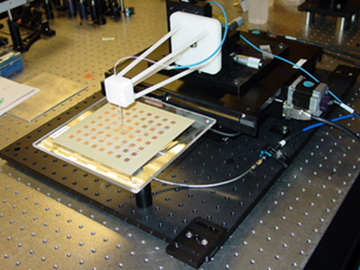
For instance, you can examine the inter-element coupling effects in passive and active phased arrays. The figure below shows a 64-element fixed-beam X-band patch antenna array with an elaborate micostrip corporate feed network operating at 10.65GHz. The array was designed with a uniform amplitude distribution, i.e., it should supply equal powers to all the 64 patch radiators.
As the video shows, the low-resolution near-field maps at a higher height above the array surface provide a good estimate of the far-field radiation patterns, but they do not reveal much about the field distribution of the individual radiating elements. To accomplish the latter, you have to bring the probe down much closer to the radiating aperture. From the figures below, you can easily see that a large portion of the supplied RF power is trapped in the feeding transmission lines, and some patch elements receive much lower power levels than the others.
The Perfect Solution for Characterizing Ultra-wideband Antenna Systems
Characterization of the radiation patterns of ultra-wideband Antenna Systems is a very challenging task. Whether using an anechoic chamber or a conventional near-field scanning systems, in both cases you need to utilize different types of metallic antennas with different sizes at different frequency bands.
The Perfect Solution for Characterizing High-Power Antenna Systems
Characterization of high-power active phased arrays is a very challenging task. Special considerations must be taken into account when measuring high-power antenna systems in an anechoic chamber including operator's safety. NeoScan probes can handle field intensities as large as 2MV/m and can even withstand higher radiated power levels. EMAG's unique probe and optical processing technology allows standoff distances as long as 50 meters between the probe location at the aperture of the high-power array and the optical mainframe and processing unit. This enables you to readily characterize very high-power antenna systems very accurately in a totally non-invasive manner without any serious safety or logistic concerns.


